If you’re asking what is the digital divide, it’s the gap between people who can get online well and people who can’t. It tends to follow income, place, race and age.
For practical next steps, a companion guide explains how to find local community news when connections and devices are uneven.
| Item | Value |
|---|---|
| Households with broadband, 2010 (NTIA) | 68% |
| Broadband at home, Black vs White households, 2010 | 55% vs 72% |
| Broadband at home, rural vs urban households, 2010 | 57% vs 70% |
| Americans who subscribe to broadband at home (Pew survey, February to June 2025) | Eight in ten |
| Home broadband gap by income (Pew, 2025) | 40 percent more common at $100,000-plus than under $30,000 |
The figures come from NTIA’s November 2011 post and Broadband Breakfast’s January 2026 report on a Pew survey. Figures can change, so check the source before you rely on them.
What the digital divide means
The digital divide is the gap between people who have good access to internet technology and people who do not. WorkingNation’s March 2025 deep dive notes that studies have found divides between suburban, urban and rural areas, and divides based on income, education, race and age.
It matters because daily life has moved online. The Information Technology and Innovation Foundation (ITIF) wrote in its May 2023 report that health care, education, work and finance offer online versions that are frequently cheaper and more accessible than in-person ones.
The same report warns that dividing lines between broadband haves and have-nots often follow the same patterns as other inequities. That risks making existing disadvantages worse rather than easing them.
Access, hardware and skills
WorkingNation describes a common way to picture the problem, a three-legged stool. Each leg is something a person needs:
- Access to reliable high-speed broadband.
- Hardware, preferably a large-screen device such as an up-to-date computer.
- Digital skills to use both well.
A Brookings Institution researcher quoted in the same piece says the stool is not the whole story. Her point is that you can “build it and they won’t come,” so people also need encouragement to take part online.
What the 2011 federal report found
On November 9, 2011, two federal agencies released a report called “Exploring the Digital Nation: Computer and Internet Use at Home”. It found that broadband adoption rose to 68% of households in 2010, from 51% three years earlier and 64% in 2009.
Progress was uneven, though. NTIA reported these 2010 shares of households with home broadband:
- Asian households: 81%
- White households: 72%
- Hispanic households: 57%
- Black households: 55%
The same post found an urban-rural gap too, with 70% of urban households online at home against 57% of rural households. It said income and education explain much, but not all, of the divide.
Why people stay offline
The 2011 report also asked households without any internet service why. The main reasons, according to NTIA, were lack of need or interest (47%), lack of affordability (24%) and an inadequate computer (15%). Yet 27% of dial-up users said broadband was not available in their area.

ITIF’s 2023 report says NTIA’s Internet Use Survey is the most authoritative source on nonadoption, meaning the choice not to subscribe to home broadband. The survey lets respondents pick from six reasons:
- Lack of availability
- The price of a subscription
- Privacy or security concerns
- The ability to use the internet elsewhere
- Lack of a computer
- Lack of interest or need
ITIF splits the disconnected into two groups: people who would subscribe but have no service at home, and people who have service available but choose not to adopt. It concludes there is significant evidence that the main cause of the divide is now on the adoption side and not a lack of networks.
The picture in the 2025 Pew survey
Pew Research Center ran its annual technology survey from February to June 2025 and released the results on January 8, 2026, according to Broadband Breakfast. Nine in ten U.S. adults use the internet daily, and 41 percent say they are online almost constantly.
Even so, income remains the most consistent dividing line. Home broadband subscriptions are 40 percent more common in households making $100,000-plus than in households making under $30,000, the Pew study stated, and about eight in ten Americans subscribe at home.
Smartphones are filling some of the gap. The same report says 78 percent of adults 65 and older own one, while home broadband subscriptions fell 7 percent over two years among young adults and Hispanic adults.
WorkingNation, citing Pew, adds a place-based view: 85% of suburban users, 76% of urban users and 73% of rural users have home broadband. It also reports that 96% of U.S. adults say they use the internet, up from 52% in 2000.
Skills, devices and coverage gaps
Being connected is not the same as being able to use everything online. WorkingNation cites a National Skills Coalition study finding nearly a third of U.S. workers lack digital skills, even though more than 90% of jobs require some. It adds that people in several lower-income, lower-education, Black, Hispanic and older groups are more likely to say a smartphone is their only computing device.
Coverage gaps remain a separate issue. The same article cites a Benton Institute analysis of FCC data that counted 7.5 million locations unserved or underserved by broadband, and points readers to the FCC’s National Broadband Map.
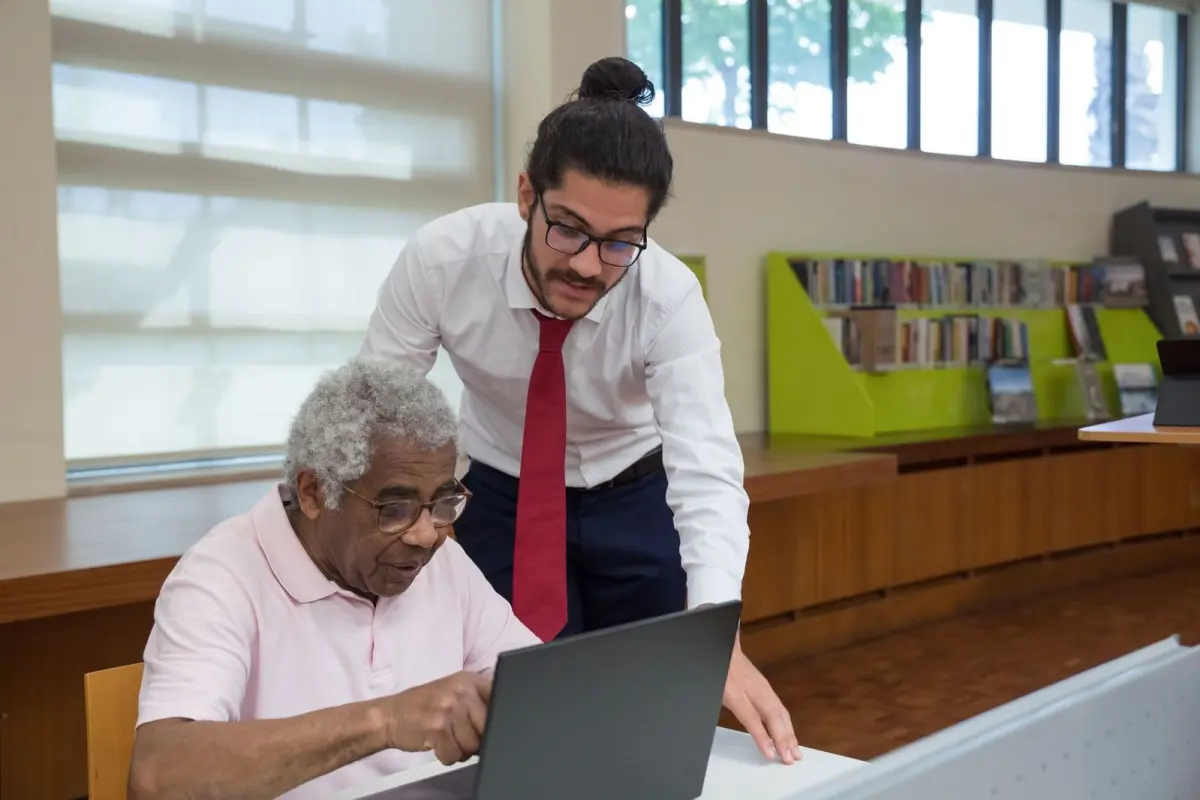
ITIF argues that digital navigators can help people sign up for low-cost plans and work out how to use a connection. Its report calls individualized, flexible approaches the way to get people online.
Efforts to close the gap, and why it matters for community media
Federal money has been a large part of the response. WorkingNation describes the $42.45 billion Broadband Equity, Access and Deployment (BEAD) program and the $2.75 billion Digital Equity Act, both disbursed through NTIA. As of that March 2025 report, the state of these programs was described as uncertain.
Earlier efforts took a similar line. In its 2011 post, NTIA said its Broadband Technology Opportunities Program was expanding public computer centers, teaching online skills and bringing broadband to unserved and underserved communities.
For community media, the divide affects who can read, watch or contribute to local reporting online. A household with a phone but no home broadband may find some websites and video harder to use, so local information often needs more than one route.
Readers who want related background can see what is a community archive for how local records are kept, and what is juneteenth for a community observance that many people look up online.
Frequently asked questions
Is the digital divide only about internet access?
Show answer
No. Sources describe a mix of connection, hardware and skills, and ITIF’s May 2023 report says the divide is now more a problem of adoption than of networks being built.
Who is most affected by the digital divide?
Show answer
Surveys find gaps by income, race, place and age. In NTIA’s 2010 data, 55% of Black households and 57% of Hispanic households had home broadband, and in Pew’s 2025 survey income was still the most consistent divide.
Has the gap gotten smaller?
Show answer
Adoption has risen overall, from 68% of households in NTIA’s 2010 figures to about eight in ten Americans in Pew’s 2025 survey. The two surveys differ in method, so treat the comparison as a rough guide, and note that gaps persist in both.
Why do some people choose not to subscribe?
Show answer
In NTIA’s 2011 report, the most common reason was lack of need or interest at 47%, followed by affordability at 24%. ITIF adds that some people face structural barriers such as housing, and others are simply not interested.